Usage statistics
WebSummoner keeps live usage statistics, exposed at:
curl http://localhost:4444/status{ "total": 80, "used": 10, "queued": 0, "pending": 1, "browsers": { "firefox": { "155.0": { "user1": { "count": 1, "sessions": [ { "id": "a7a2b801-21db-4dae-a99b-4cbc0b81de96", "vnc": false, "screen": "1920x1080x24" } ] }, "user2": { "count": 6, "sessions": [] } } } }}Users are taken from basic HTTP authentication headers.
What the numbers mean
Section titled “What the numbers mean”A session request goes through a small state machine:
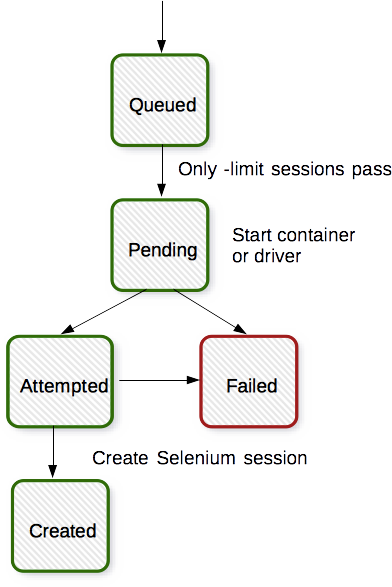
- Request arrives. The
-limitflag caps simultaneous sessions — this istotal. - Queue. When all slots are taken, new requests block in
queued. A request carrying theX-WebSummoner-No-Waitheader skips the queue entirely: if no slot is free, WebSummoner replies immediately with429 Too Many Requestsinstead of making the client wait. - Pending. A freed slot starts a container or driver process; requests
during startup count as
pending. WebSummoner waits for the service port to answer before proceeding. - Created / failed. WebSummoner performs the WebDriver new-session call
itself; success adds to
used, failure returns an error to the client. - Proxying. From then on, all session traffic is proxied to the same container or driver until the session is deleted.
So a healthy idle hub shows used close to your real load and queued/pending
near zero; a persistently non-zero queued means you need a higher -limit
(or more hub instances behind GGR).
Prometheus metrics
Section titled “Prometheus metrics”WebSummoner exposes a /metrics endpoint in Prometheus text format — no
client library needed, point your scraper at it:
scrape_configs: - job_name: websummoner static_configs: - targets: ["websummoner-host:4444"]Available metrics
Section titled “Available metrics”| Metric | Type | Meaning |
|---|---|---|
websummoner_sessions_active | gauge | Currently running browser sessions |
websummoner_sessions_limit | gauge | Maximum simultaneous sessions (-limit flag) |
websummoner_queue_depth | gauge | Requests waiting in the queue |
websummoner_queue_pending | gauge | Requests being processed |
websummoner_queue_congested | gauge | 1 while the hub is shedding load — see Session queue |
websummoner_browser_sessions{browser="chrome:152.0"} | gauge | Sessions per browser/version |
websummoner_sessions_created_total | counter | Sessions successfully created |
websummoner_sessions_failed_total | counter | Sessions that failed to start |
websummoner_sessions_timed_out_total | counter | Sessions closed by idle timeout |
websummoner_sessions_deleted_total | counter | Sessions deleted by client |
websummoner_video_sessions_total | counter | Sessions with video recording |
websummoner_vnc_sessions_total | counter | Sessions with VNC enabled |
websummoner_audio_sessions_total | counter | Sessions with audio recording |
websummoner_queue_rejected_total{reason="no_wait"} | counter | Refused because the client opted out of waiting |
websummoner_queue_rejected_total{reason="timeout"} | counter | Refused after waiting the full budget on a healthy queue |
websummoner_queue_rejected_total{reason="shed"} | counter | Refused early because the grid is saturated |
Example output:
# HELP websummoner_sessions_active Currently running browser sessions# TYPE websummoner_sessions_active gaugewebsummoner_sessions_active 3websummoner_sessions_limit 5websummoner_queue_depth 0Suggested alerts
Section titled “Suggested alerts”- alert: WebSummonerQueueBacklog expr: websummoner_queue_depth > 10 for: 5m
# Prefer this over the backlog alert when -queue-timeout is set: it fires only# when the hub has stopped keeping up, not when a burst is being absorbed.- alert: WebSummonerSaturated expr: websummoner_queue_congested == 1 for: 2m
- alert: WebSummonerHighFailureRate expr: rate(websummoner_sessions_failed_total[5m]) > 0.1 for: 10m
- alert: WebSummonerAtCapacity expr: websummoner_sessions_active / websummoner_sessions_limit > 0.9 for: 15mHealth checks for orchestrators
Section titled “Health checks for orchestrators”Kubernetes liveness/readiness probes and load balancer health checks often
send HEAD requests (no body). WebSummoner supports both methods on its
health endpoints:
HEAD /ping→200 OK(always, when the process is alive)GET /ping→ JSON with uptime, last reload time and request countHEAD /status→200 OKwhen ready (slots available),503 Service Unavailablewhen fullGET /status→ the full usage JSON shown above
Example Kubernetes probe:
livenessProbe: httpGet: path: /ping port: 4444readinessProbe: httpGet: path: /status port: 4444Shipping statistics elsewhere
Section titled “Shipping statistics elsewhere”Any collector that reads JSON over HTTP works — for example Telegraf forwarding to Graphite:
-
Generate a config:
Terminal window mkdir -p /etc/telegrafdocker run --rm telegraf:alpine \--input-filter httpjson \--output-filter graphite config > /etc/telegraf/telegraf.conf -
Point it at the status endpoint:
[agent]interval = "10s"[[outputs.graphite]]servers = ["my-graphite-host.example.com:2024"]prefix = "one_min"template = "host.measurement.field"[[inputs.httpjson]]name = "websummoner"servers = ["http://localhost:4444/status"] -
Run it:
Terminal window docker run --net host -d --name telegraf \-v /etc/telegraf:/etc \telegraf:alpine --config /etc/telegraf.conf